
Core Concepts of AI/ML for Earth Observation

CoPhil EO AI/ML Training - Day 1, Session 2

Stylianos Kotsopoulos

EU-Philippines CoPhil Programme

Welcome to Session 2

Session Objectives

  • Understand what AI/ML means in Earth Observation context
  • Learn the end-to-end workflow for ML projects
  • Distinguish supervised vs unsupervised learning
  • Grasp deep learning and neural network basics
  • Explore 2025 AI innovations (foundation models, data-centric AI)

Duration: 2 hours

Session Roadmap

Time Topic Duration
00-10 min What is AI/ML? 10 min
10-35 min EO Workflow & Data Pipeline 25 min
35-60 min Supervised vs Unsupervised Learning 25 min
60-65 min ☕ Break 5 min
65-90 min Deep Learning & Neural Networks 25 min
90-110 min Data-Centric AI & 2025 Updates 20 min
110-120 min Q&A & Summary 10 min

Why AI/ML for Earth Observation?

Traditional Approach

  • Manual interpretation
  • Rule-based classification
  • Simple thresholds
  • Time-consuming
  • Hard to scale

AI/ML Approach

  • Automated pattern recognition
  • Learn from examples
  • Complex decision boundaries
  • Fast processing
  • Scalable to large areas

ML can process years of satellite data in hours!

What is AI/ML?

Defining the Terms

AI, ML, and Deep Learning Hierarchy with EO Applications

  • Artificial Intelligence (AI): Broad field of making machines “smart”
  • Machine Learning (ML): Subset of AI where algorithms learn from data
  • Deep Learning (DL): Subset of ML using neural networks with many layers

Machine Learning in Simple Terms

Traditional Programming

Rules + Data → Results
  • Programmer writes explicit rules
  • Fixed logic
  • Hard to handle complexity

Machine Learning

Data + Results → Rules
  • Algorithm learns rules from examples
  • Adaptive
  • Handles complex patterns

ML in Earth Observation Context

Example: Forest vs Non-Forest

Traditional:

IF NDVI > 0.6 THEN Forest
ELSE Non-Forest

Simple, but breaks easily

Machine Learning:

  • Show 1000 examples of forest pixels
  • Show 1000 examples of non-forest
  • Algorithm learns complex patterns
  • Works in diverse conditions

The AI/ML Workflow for EO

End-to-End ML Workflow

–>

Step 1: Problem Definition

Key Questions

  • What exactly are we trying to achieve?
  • What decisions will this support?
  • What level of accuracy is needed?
  • What resources are available?

EO Examples

  • Map rice paddy extent
  • Detect flooded areas after typhoon
  • Classify land cover types
  • Estimate crop yield
  • Monitor deforestation

Clear problem definition = 50% of success

Step 2: Data Acquisition

Satellite Imagery

  • Sentinel-1/2 (covered in Session 1!)
  • Landsat
  • Planet
  • High-resolution commercial
  • Multiple dates/seasons

Ground Truth / Labels

  • Field surveys
  • GPS points
  • Existing maps
  • Photo interpretation
  • Expert knowledge

Challenge: Getting quality labels is often hardest part

Step 3: Data Preprocessing

For Satellite Imagery:

  • Atmospheric correction (use Level-2A!)
  • Cloud masking
  • Geometric correction
  • Radiometric calibration
  • Co-registration (multiple sensors)
  • Temporal compositing

“Garbage In, Garbage Out” - preprocessing matters!

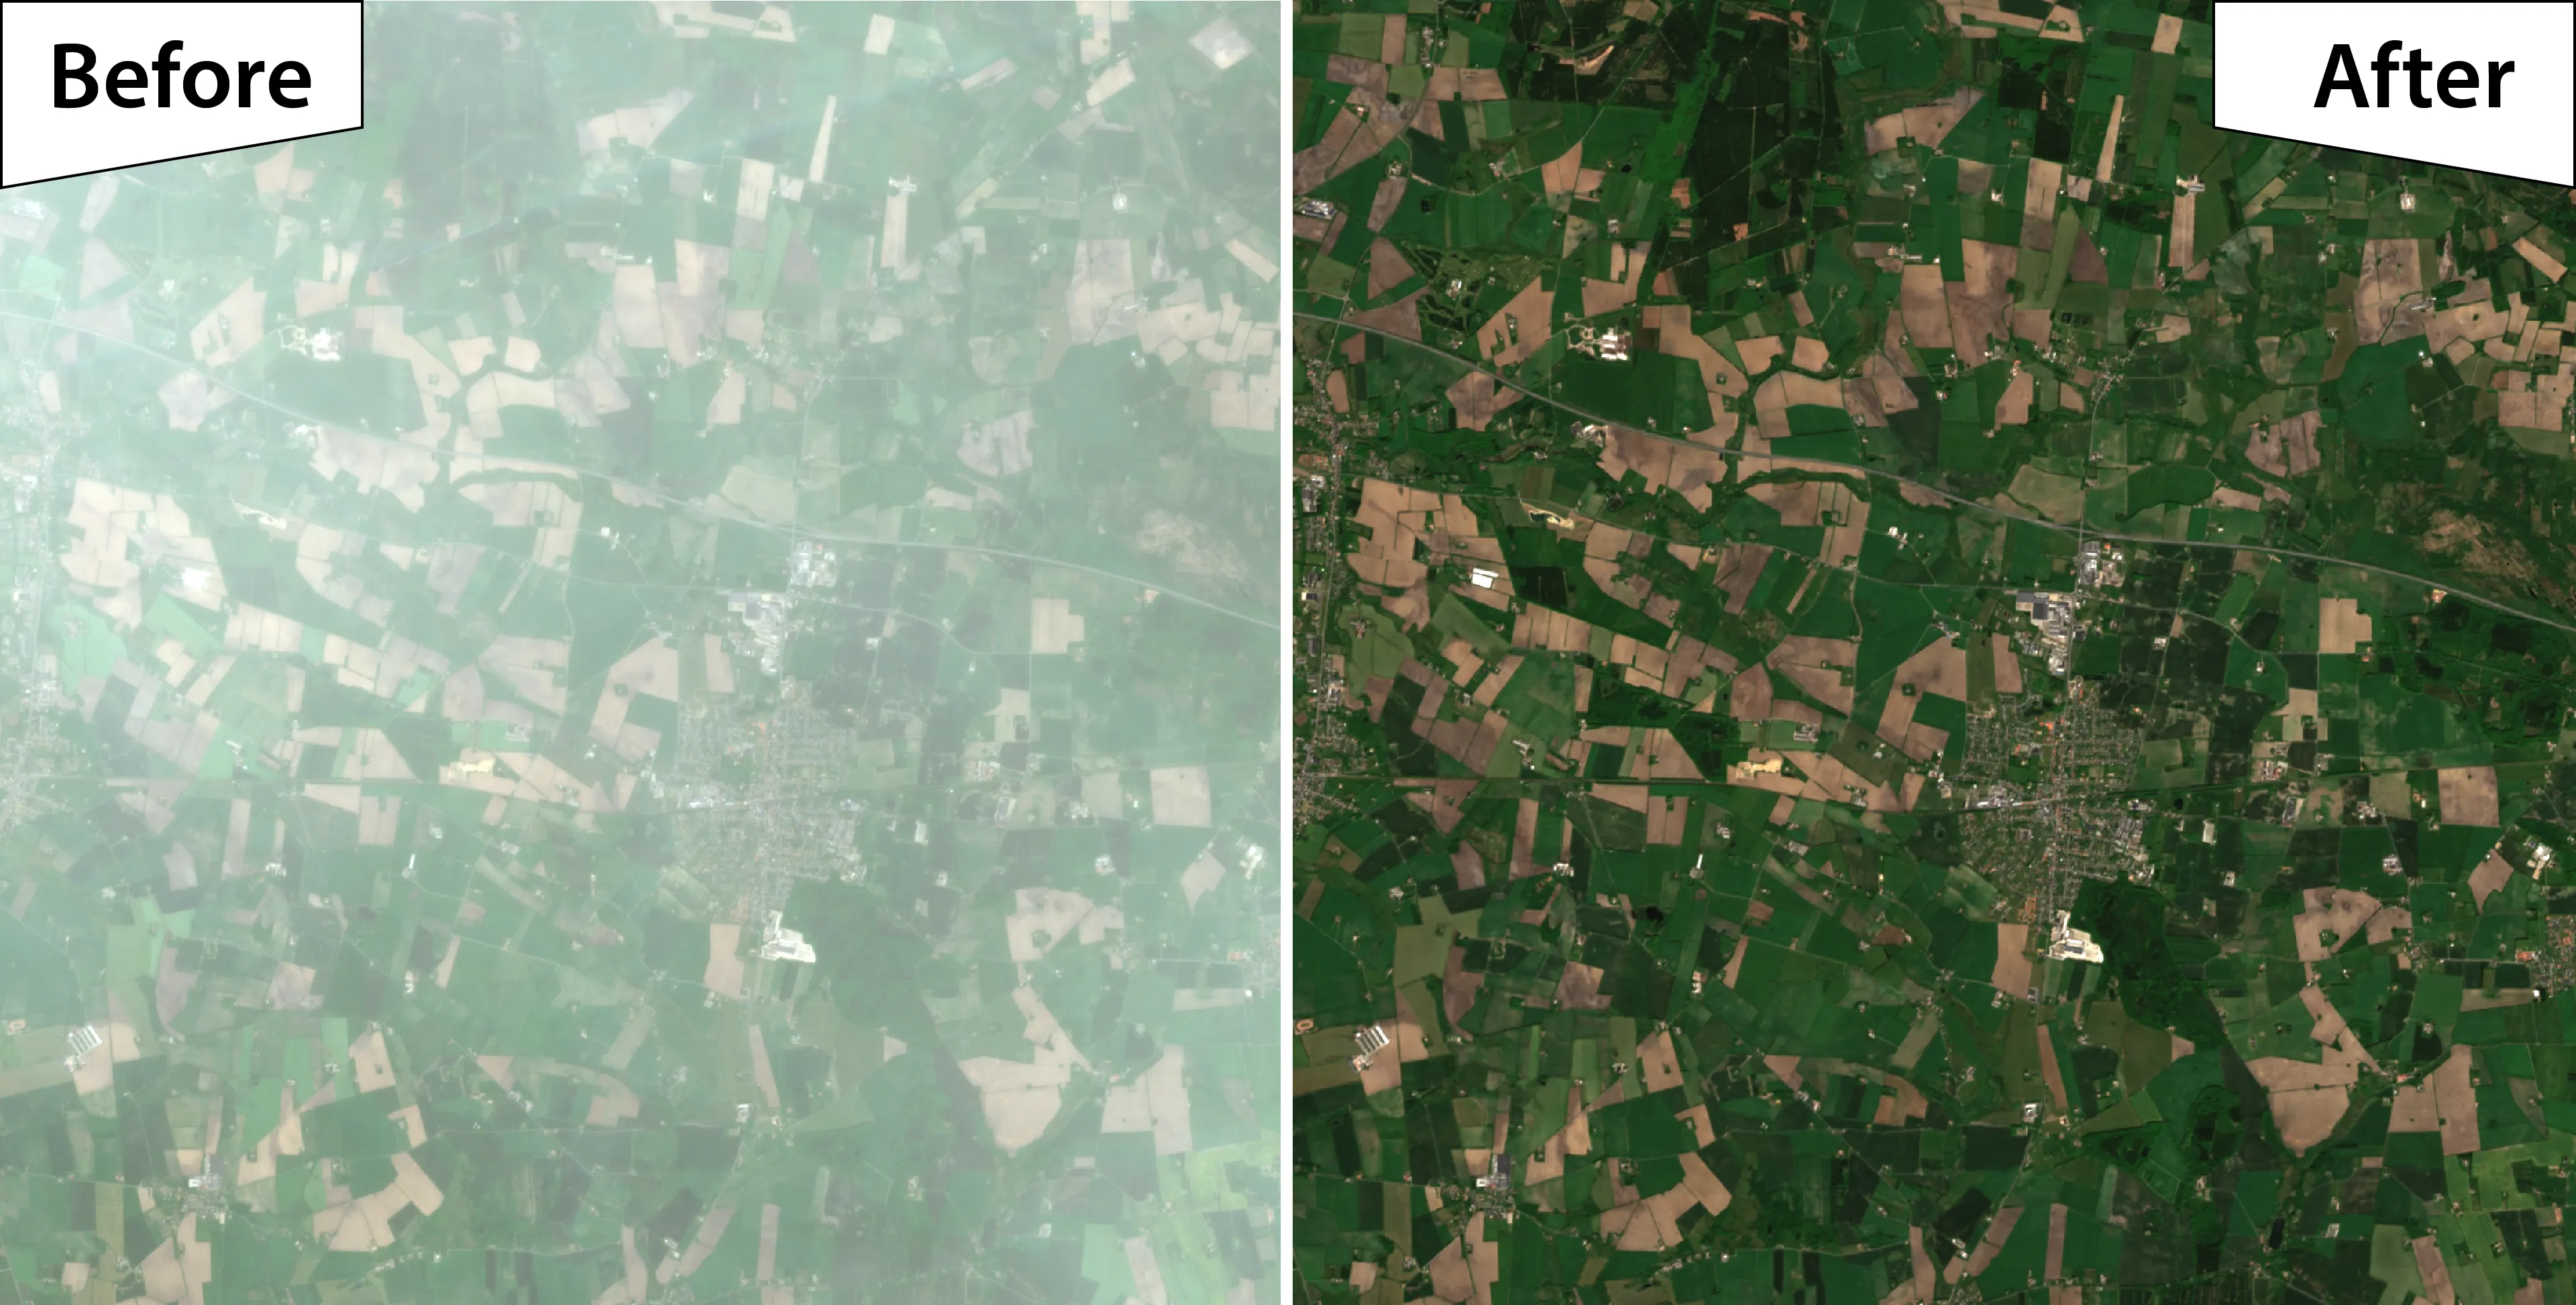
Preprocessing Example

Cloud Removal Before and After Comparison

Before Preprocessing: - Clouds present - Atmospheric haze - Different acquisition dates

After Preprocessing: - Clouds masked - Atmospherically corrected - Temporal composite created

Step 4: Feature Engineering

What are Features?

  • Input variables for the model
  • Derived from raw data
  • Informative for the task

EO Features

  • Spectral bands (Blue, Red, NIR, etc.)
  • Spectral indices (NDVI, NDWI)
  • Texture measures
  • Temporal statistics
  • Topography (elevation, slope)

Deep Learning: Often learns features automatically!

Common EO Features

Feature Type Examples What They Capture
Spectral Bands B2, B3, B4, B8 Reflectance at different wavelengths
Vegetation Indices NDVI, EVI, SAVI Vegetation health, density
Water Indices NDWI, MNDWI Water presence, moisture
Texture GLCM variance, entropy Spatial patterns
Temporal Mean, std over time Phenology, seasonality
Topographic Elevation, slope, aspect Terrain characteristics

Step 5: Model Selection & Training

Model Selection

Choose based on:

  • Problem type (classification vs regression)
  • Data size
  • Interpretability needs
  • Computational resources

Common EO Models

  • Random Forest
  • Support Vector Machines
  • Convolutional Neural Networks
  • U-Net (segmentation)
  • Recurrent networks (time series)

Training Process

–>{fig-align=“center” width=“75%”}

  1. Split data: Training set (70-80%) & Validation set (20-30%)
  2. Feed training data to model
  3. Model learns patterns by adjusting internal parameters
  4. Validate on unseen validation data
  5. Iterate: Adjust model or data if needed

Step 6: Validation & Evaluation

Why Validate?

  • Ensure model generalizes
  • Detect overfitting
  • Compare different models
  • Build confidence

Evaluation Metrics

  • Overall Accuracy
  • Confusion Matrix
  • Precision & Recall
  • F1-Score
  • Kappa coefficient

Use independent test data - never validate on training data!

Confusion Matrix Example

What it shows:

  • True Positives (correct predictions)
  • False Positives (type I error)
  • False Negatives (type II error)
  • True Negatives

Derived Metrics:

  • Precision = TP / (TP + FP)
  • Recall = TP / (TP + FN)
  • Accuracy = (TP + TN) / Total

Step 7: Deployment

Deployment Options

  • Generate full maps
  • Near real-time monitoring
  • Operational pipelines
  • Decision support systems
  • Web applications

Considerations

  • Model retraining schedule
  • Computational requirements
  • User interface
  • Data updates
  • Maintenance plan

Workflow is Iterative

–>{fig-align=“center” width=“70%”}

  • Poor validation? → Go back to data acquisition or model selection
  • New data available? → Retrain model
  • Requirements change? → Redefine problem
  • Continuous improvement is key

Types of Machine Learning

Main ML Paradigms

–>{fig-align=“center” width=“75%”}

  1. Supervised Learning (most common in EO)
  2. Unsupervised Learning (exploratory analysis)
  3. Semi-supervised Learning (combines both)
  4. Reinforcement Learning (less common in EO)

Supervised Learning

What is Supervised Learning?

Definition

  • Learning from labeled data
  • Known input-output pairs
  • Model learns mapping from inputs to outputs
  • Like learning with an answer key

–>{width=“100%”}

Requires ground truth labels for training

Two Types of Supervised Learning

Classification

  • Predict categorical labels
  • Discrete classes
  • Example outputs: “Forest”, “Water”, “Urban”

Regression

  • Predict continuous values
  • Numeric outputs
  • Example outputs: 25.3 tons/hectare, 15.2°C

Classification Examples in EO

Land Cover Classification

  • Forest, agriculture, urban, water
  • Pixel-wise or object-based
  • Multi-class problem

Crop Type Mapping

  • Rice, corn, sugarcane
  • Seasonal patterns important
  • Supports agricultural planning

Regression Examples in EO

Biomass Estimation

  • Predict tons of biomass per hectare
  • Important for carbon accounting
  • Uses SAR and optical data

Crop Yield Prediction

  • Predict tons per hectare
  • Seasonal NDVI time series
  • Supports food security planning

Common Supervised Algorithms

Algorithm Strengths EO Applications
Random Forest Handles high dimensions, robust Land cover, crop classification
SVM Effective in high dimensions Binary classification, change detection
Neural Networks Learns complex patterns Image classification, segmentation
Decision Trees Interpretable Quick classifications
k-NN Simple, non-parametric Local classifications

Supervised Learning Requirements

Essential:

  1. Training data with known labels
  2. Representative samples covering all classes
  3. Sufficient quantity (varies by algorithm)
  4. Quality labels (accurate, consistent)
  5. Independent validation data

Challenge: Getting quality labels is often the bottleneck!

Unsupervised Learning

What is Unsupervised Learning?

Definition

  • Learning from unlabeled data
  • No known outputs
  • Discover hidden patterns
  • Like sorting without instructions

–>{width=“100%”}

Useful for exploratory analysis and finding structure

Clustering: Main Unsupervised Technique

–>{fig-align=“center” width=“70%”}

  • Group similar pixels based on spectral characteristics
  • Algorithm decides number of clusters (or you specify)
  • Analyst interprets what each cluster means
  • Example: “Cluster 3 looks like water, Cluster 7 looks like forest”

Unsupervised EO Applications

Change Detection

  • Cluster “before” and “after” images
  • Identify changed areas
  • No labels needed

Anomaly Detection

  • Find unusual pixels
  • Potential forest disturbance
  • Data quality issues

Initial Exploration

  • Quick overview of spectral classes
  • Inform supervised approach
  • Generate training samples

Dimensionality Reduction

  • PCA, t-SNE
  • Visualize high-dimensional data
  • Feature extraction

Supervised vs Unsupervised

Aspect Supervised Unsupervised
Labels Required Not needed
Accuracy Generally higher Lower, needs interpretation
Use Case Precise classification Exploration, pattern discovery
Effort High (collecting labels) Low (no labels)
Output Predefined classes Discovered clusters
Control High (you define classes) Low (algorithm decides groups)

Which to Choose?

Use Supervised When:

  • You have ground truth labels
  • Need specific classes
  • Accuracy is critical
  • Operational application

Use Unsupervised When:

  • No labels available
  • Exploratory analysis
  • Discovering unknown patterns
  • Quick initial assessment

In practice: Often combine both approaches!

☕ 5-Minute Break

Stretch Break

Stand up • Grab water • Back in 5 minutes

Introduction to Deep Learning

What is Deep Learning?

Deep Learning = Neural Networks with Many Layers

  • Subset of machine learning
  • “Deep” refers to multiple layers
  • Automatically learns features
  • Excels at image analysis
  • Data-hungry

–>{width=“100%”}

Neural Networks: Building Blocks

–>{fig-align=“center” width=“70%”}

Artificial Neuron:

  1. Takes multiple inputs
  2. Multiplies each by a weight
  3. Adds a bias
  4. Applies activation function
  5. Produces output

Neural Network Architecture

–>{fig-align=“center” width=“80%”}

Layers:

  • Input Layer: Receives data (e.g., pixel values)
  • Hidden Layers: Process and transform
  • Output Layer: Final prediction

Connections:

  • Each neuron connects to next layer
  • Weights on connections
  • Information flows forward

Key Concepts

Activation Functions

  • Introduce non-linearity
  • Common: ReLU, Sigmoid, Tanh
  • Allow network to learn complex patterns

Weights and Biases

  • Parameters the network learns
  • Millions of parameters in deep networks
  • Adjusted during training

Forward Propagation

  • Data flows input → output
  • Generate prediction

How Neural Networks Learn

–>{fig-align=“center” width=“75%”}

  1. Forward pass: Input data, get prediction
  2. Calculate loss: How wrong is the prediction?
  3. Backpropagation: Calculate gradients
  4. Update weights: Adjust to reduce error
  5. Repeat: Thousands of times (epochs)

Loss Functions

Classification

Cross-Entropy Loss

  • Measures classification error
  • Higher penalty for confident wrong predictions
  • Standard for multi-class problems

Regression

Mean Squared Error

\[MSE = \frac{1}{n}\sum_{i=1}^{n}(y_i - \hat{y}_i)^2\]

  • Measures prediction error
  • Squared difference from true value

Optimizers

Stochastic Gradient Descent (SGD)

  • Basic optimizer
  • Updates weights based on gradients
  • Learning rate controls step size

Adam Optimizer

  • Adaptive learning rates
  • Faster convergence
  • Most popular for deep learning
  • Generally works well

You don’t need to implement these - frameworks do it for you!

Convolutional Neural Networks (CNNs)

Specialized for images:

  • Convolutional layers: Detect spatial patterns
  • Pooling layers: Reduce dimensionality
  • Fully connected layers: Final classification
  • Automatically learn features (edges, textures, objects)

How CNNs Process Images

–>{fig-align=“center” width=“80%”}

Hierarchical Feature Learning:

  • Early layers: Detect edges, simple patterns
  • Middle layers: Detect textures, parts
  • Later layers: Detect objects, scenes
  • No manual feature engineering needed!

CNNs in Earth Observation

Applications:

  • Image classification
  • Object detection (ships, buildings)
  • Semantic segmentation (pixel-wise)
  • Change detection
  • Super-resolution

Advantages:

  • Learn features automatically
  • Handle spatial context
  • State-of-the-art performance
  • Transfer learning possible

ResNet: Residual Networks

–>{fig-align=“center” width=“70%”}

Key Innovation: Skip Connections

  • Allows training very deep networks (50, 101, 152 layers)
  • Solves vanishing gradient problem
  • Identity mapping preserves information

Common Variants: - ResNet-50 (25M parameters) - ResNet-101 (44M parameters) - ResNet-152 (60M parameters)

EO Applications:

  • Pre-trained on ImageNet
  • Fine-tune for EO tasks
  • Backbone for object detection
  • Transfer learning baseline

Performance: - Top-5 error: 3.57% (ImageNet) - Works well with 10k+ images

U-Net for Semantic Segmentation

Architecture: - Encoder (contracting path): Captures context - Decoder (expanding path): Enables precise localization - Skip connections: Combine low & high-level features

Why Dominant in EO: - Works with small datasets (hundreds of images) - Precise pixel-wise predictions - Perfect for segmentation tasks

EO Applications: Flood mapping, land cover, building footprints, crop fields

Deep Learning Frameworks

TensorFlow / Keras

–>{width=“150px”}

  • Google’s framework
  • High-level Keras API
  • Production-ready
  • Large ecosystem

PyTorch

–>{width=“150px”}

  • Facebook’s framework
  • Pythonic and intuitive
  • Popular in research
  • Flexible

We’ll use TensorFlow/Keras in this training

Deep Learning Considerations

Advantages:

  • Automatic feature learning
  • State-of-the-art accuracy
  • Handles complex patterns
  • Scales to big data

Challenges:

  • Requires lots of training data
  • Computationally intensive (need GPUs)
  • Less interpretable (“black box”)
  • Harder to debug

Start simple (Random Forest), move to DL when you have data and compute

Benchmark Datasets for EO

Why Benchmark Datasets Matter

  1. Standardized Evaluation - Compare algorithms objectively
  2. Training Resources - Pre-labeled data for model training
  3. Transfer Learning - Pre-train on large datasets, fine-tune locally
  4. Research Reproducibility - Enable comparison across studies
  5. Community Building - Shared resources accelerate progress

You don’t need to label everything from scratch!

EuroSAT: Land Cover Classification

Specifications: - Images: 27,000 labeled patches - Classes: 10 land cover types - Size: 64×64 pixels - Bands: All 13 Sentinel-2 bands - Source: European cities

10 Classes: Annual Crop • Forest • Herbaceous Vegetation • Highway • Industrial • Pasture • Permanent Crop • Residential • River • Sea/Lake

–>{width=“100%”}

Achievement: 98.57% accuracy with CNNs

Why Popular: - Sentinel-2 based - Balanced classes - Easy to use

BigEarthNet: Large-Scale Multi-Label

Massive Scale: - Images: 590,326 Sentinel-2 patches - Coverage: 10 European countries - Labels: 43 land cover classes - Multi-label: Multiple classes per image - Multi-modal: Optical + SAR version

Real-World Complexity: - Forest + Water - Urban + Agricultural - Reflects actual landscapes

Why Different:

Unlike EuroSAT (single label), BigEarthNet has multiple overlapping classes - more realistic!

Access: - bigearth.net - TensorFlow Datasets - Papers With Code

xView: Object Detection Benchmark

Specifications: - Objects: >1 million annotated - Classes: 60 object types - Resolution: 0.3m (WorldView-3) - Area: >1,400 km² - Annotations: Bounding boxes

Object Categories: - Buildings & infrastructure - Vehicles (cars, trucks, aircraft) - Ships & maritime - Storage tanks - Construction equipment

Created for disaster response

Applications: - YOLO training - Faster R-CNN - Small object detection - Infrastructure mapping

Philippine Data Resources

PRiSM (PhilRice) - Rice area maps (wet/dry season) - Planting dates & growth stages - Yield estimates - Since 2014 - https://prism.philrice.gov.ph/

PhilSA Products - Flood extent maps (DATOS) - Mangrove extent mapping - Land cover classifications - Disaster damage assessments

DOST-ASTI Outputs - DATOS rapid flood mapping - Hazard susceptibility maps - AI-powered damage assessment - hazardhunter.georisk.gov.ph

NAMRIA Geoportal - National land cover (2020) - Topographic basemaps - Administrative boundaries - Digital Elevation Models - www.geoportal.gov.ph

Use these as training/validation data - don’t start from scratch!

Data-Centric AI & 2025 Innovations

Paradigm Shift: Model-Centric vs Data-Centric

–>{fig-align=“center” width=“80%”}

Model-Centric (Traditional)

  • Focus on improving algorithms
  • Keep data fixed
  • Try different models
  • Tune hyperparameters

Data-Centric (Modern)

  • Focus on improving data
  • Keep model fixed
  • Clean and augment data
  • Better annotations

Why Data-Centric Matters for EO

EO-Specific Data Challenges:

  • Cloud contamination
  • Atmospheric effects
  • Sensor artifacts and noise
  • Label uncertainty
  • Geographic variability
  • Temporal dynamics
  • Class imbalance

“Better data beats a cleverer model” in most cases

2025 Research: Data Efficiency

–>{fig-align=“center” width=“70%”}

Key Finding (ArXiv 2025):

  • Some EO datasets reach optimal accuracy with <20% of temporal instances
  • Single band from single modality can be sufficient
  • Data efficiency crucial for operational systems
  • Quality over quantity

Four Pillars of Data-Centric AI

1. Data Quality

  • Cloud/shadow removal
  • Atmospheric correction
  • Sensor calibration
  • Geometric accuracy

2. Data Quantity

  • Sufficient training samples
  • Balanced classes
  • Data augmentation
  • Transfer learning

Four Pillars (Continued)

3. Data Diversity

  • Multiple seasons
  • Different regions
  • Various conditions
  • Class variations

4. Label Quality

  • Clear definitions
  • Consistent protocols
  • Expert validation
  • Accurate geolocation

Data Quality

Data Quality in EO

Common Issues:

  • Clouds and shadows
  • Haze and aerosols
  • Sensor artifacts (striping, banding)
  • Geometric misalignment
  • Radiometric inconsistencies
  • Mixed pixels at boundaries

Solutions:

  • Use Level-2A products
  • Rigorous cloud masking
  • Quality flag filtering
  • Multi-temporal compositing
  • Validation checks
  • Document preprocessing

Quality Example: Cloud Masking

Without Cloud Masking

  • Clouds misclassified
  • Shadows cause errors
  • Poor model performance

With Proper Masking

  • Clean training data
  • Accurate classifications
  • Better generalization

One cloudy image can ruin your training data!

Data Quantity

How Much Data Do You Need?

Depends on:

  • Model complexity (DL needs more)
  • Problem difficulty
  • Class separability
  • Available features

General Guidelines:

  • Traditional ML: 100s to 1000s of samples per class
  • Deep Learning: 1000s to 10,000s per class
  • Transfer Learning: Can work with 100s per class

Data Augmentation

Techniques:

  • Rotation (90°, 180°, 270°)
  • Flipping (horizontal, vertical)
  • Brightness/contrast adjustment
  • Adding noise
  • Elastic deformations

Result: 10x more training samples from existing data!

Transfer Learning

–>{fig-align=“center” width=“75%”}

Concept:

  • Start with model pre-trained on large dataset
  • Fine-tune on your specific task
  • Requires much less data

EO Applications:

  • Use ImageNet pre-trained models
  • NASA-IBM Geospatial Foundation Model
  • Domain-specific pre-training

Data Diversity

Why Diversity Matters

Problem: Biased Training

  • All samples from one season
  • One geographic region only
  • Similar conditions
  • Result: Model fails elsewhere

Solution: Diverse Training

  • Multiple seasons
  • Different regions
  • Various conditions
  • Result: Model generalizes

Sources of Diversity Needed

Temporal Diversity:

  • Different seasons (wet/dry)
  • Multiple years
  • Phenological stages

Geographic Diversity:

  • Different regions
  • Various elevations
  • Coastal vs inland

Atmospheric Diversity:

  • Clear vs hazy days
  • Different solar angles
  • Seasonal lighting

Class Diversity:

  • Variations within classes
  • Edge cases
  • Transitional zones

Example: Urban Classification

Poor Diversity

  • Only Metro Manila samples
  • Only concrete roofs
  • Only high-density areas
  • Fails in other cities

Good Diversity

  • Large cities, small towns
  • Various roof materials (concrete, metal, nipa)
  • Different architectural styles
  • Different densities
  • Works across Philippines

Label Quality

Label Quality is Critical

Common Label Issues:

  • Mislabeled samples
  • Positional errors (GPS drift)
  • Temporal mismatch (old labels, new image)
  • Ambiguous classes
  • Inconsistent definitions
  • Mixed pixels

Impact:

  • Model learns wrong patterns
  • Contradictory signals
  • Poor generalization
  • Low confidence predictions
  • Wasted compute

One bad label can corrupt model learning!

Label Quality Best Practices

1. Clear Class Definitions

  • Write explicit criteria
  • Provide examples
  • Define edge cases
  • Document ambiguities

2. Consistent Protocols

  • Standard operating procedures
  • Same interpretation rules
  • Calibration sessions
  • Regular training for labelers

3. Multiple Annotators

  • Independent labeling
  • Compare for consistency
  • Resolve disagreements
  • Build consensus labels

4. Expert Validation

  • Domain experts review samples
  • Random quality checks
  • Iterative improvement

Label Quality Example

Poor Labels

  • “Forest” defined inconsistently
  • Mixed with shrubland
  • Temporal mismatch
  • Positional errors

High-Quality Labels

  • Clear forest definition
  • Careful boundary delineation
  • Image-label temporal match
  • Validated position

ALaM Project: Addressing Labels

DOST-ASTI’s Automated Labeling Machine

  • Automates labeling process
  • Crowdsourcing capabilities
  • Expert validation workflow
  • Addresses EO’s biggest bottleneck

Practical Data-Centric Tips

Data-Centric Workflow

Before Training:

  1. Audit your data: Visualize samples, check distributions
  2. Clean aggressively: Remove clouds, fix labels, filter outliers
  3. Balance classes: Address imbalances through sampling or augmentation
  4. Document everything: Track data sources, preprocessing, versions

During Training:

  1. Analyze errors: Which samples does model get wrong?
  2. Identify patterns: Are errors systematic? (e.g., all in one region)
  3. Fix data: Add more diverse samples, improve labels
  4. Iterate: Retrain with better data

Data Quality Checklist

Case Study: Better Data = Better Results

Scenario:

Coral reef mapping project

Initial Results:

  • 70% accuracy
  • Fails in turbid water
  • Confuses reef with sand

Problem Identified:

All training data from clear water

Data-Centric Solution:

  1. Add turbid water samples
  2. Include reef-sand transition zones
  3. More diverse depths
  4. Improve label precision

New Results:

  • 90% accuracy
  • Works in turbid water
  • Better boundary detection

10x improvement from better data, same model!

2025 Developments

Foundation Models for EO

–>{fig-align=“center” width=“75%”}

What are Foundation Models?

  • Large models pre-trained on massive EO datasets
  • Learn general representations
  • Fine-tune for specific tasks
  • Dramatically reduce labeled data needs

Examples (2025):

  • Google AlphaEarth Foundations (DeepMind, 2025) - 1.4 trillion embeddings/year in GEE
  • NASA-IBM Geospatial Foundation Model (open-source, Aug 2024)
  • Prithvi (IBM/NASA/ESA collaboration)
  • Clay Foundation Model (open-source)
  • Planet Labs + Anthropic Claude integration

On-Board AI Processing

ESA Φsat-2 (Launched 2024)

  • 22×10×33 cm CubeSat
  • Onboard AI computer (Intel Myriad X VPU)
  • Real-time cloud detection
  • Process before downlink
  • Saves bandwidth

Satellogic Edge Computing

  • “AI First” satellites
  • Onboard GPUs
  • Real-time processing
  • Immediate insights
  • Ship/object detection

Self-Supervised Learning

Concept:

  • Learn from unlabeled data
  • Define pretext tasks (e.g., predict missing patches)
  • Model learns useful representations
  • Fine-tune with small labeled dataset

Why Important for EO:

  • Abundance of unlabeled satellite imagery
  • High cost of labeling
  • Improves transferability

–>{width=“100%”}

Explainable AI (XAI)

–>{fig-align=“center” width=“75%”}

Why XAI Matters:

  • Understand model decisions
  • Build trust in AI systems
  • Debug and improve models
  • Regulatory compliance

Methods:

  • SHAP: Feature importance
  • LIME: Local explanations
  • Grad-CAM: Visual attention maps
  • Saliency Maps: What pixels matter?

Summary & Key Takeaways

What We Covered

  1. AI/ML Basics: What it is and why it’s powerful for EO
  2. ML Workflow: 7-step process from problem to deployment
  3. Supervised Learning: Classification and regression with labeled data
  4. Unsupervised Learning: Clustering and pattern discovery
  5. Deep Learning: Neural networks and CNNs for images
  6. Data-Centric AI: Quality, quantity, diversity, labels
  7. 2025 Trends: Foundation models, on-board AI, XAI

Key Takeaways

1. Focus on Data First

  • Quality beats quantity
  • Diversity enables generalization
  • Good labels are gold

2. Start Simple

  • Try traditional ML before deep learning
  • Random Forest is often enough
  • Add complexity only when needed

3. Iterate Continuously

  • Analyze errors
  • Improve data
  • Retrain models
  • Deployment is not the end

Practical Advice

For Your Projects:

  • Define the problem clearly before collecting data
  • Invest in high-quality training data - it’s worth it
  • Validate rigorously on independent data
  • Document everything (data sources, preprocessing, model versions)
  • Start with baselines (simple models, existing methods)
  • Iterate based on errors - let failures guide improvements
  • Consider operational constraints early

The Data-Centric Mindset

When model performs poorly, ask:

  1. Is my data clean?
  2. Are labels accurate?
  3. Is training data representative?
  4. Do I have enough diversity?
  5. Are there systematic biases?

Before trying:

  • More complex model
  • More epochs
  • Different hyperparameters
  • New architecture

Check your data first!

“Better data beats a cleverer model” - Andrew Ng

Connection to Sessions 3 & 4

Session 3: Python Basics

  • Load and explore data
  • GeoPandas (vector)
  • Rasterio (raster)
  • Foundation for all ML work

Session 4: Google Earth Engine

  • Access Sentinel data at scale
  • Cloud masking (data quality!)
  • Temporal compositing
  • Export for ML workflows

Everything builds on these concepts!

Looking Ahead: Days 2-4

Day 2:

  • Random Forest classification
  • Land cover mapping
  • CNN basics
  • TensorFlow/Keras intro

Days 3-4:

  • U-Net for segmentation
  • Flood mapping (DRR focus)
  • Time series with LSTMs
  • Foundation models
  • Explainable AI

Resources for Continued Learning

Online Courses:

  • NASA ARSET: ML for Earth Science
  • EO College: Introduction to ML for EO
  • Coursera: Machine Learning (Andrew Ng)
  • Fast.ai: Practical Deep Learning

Papers & Tutorials:

  • “Data-Centric ML for Earth Observation” (ArXiv 2025)
  • Google Earth Engine tutorials
  • TensorFlow Earth Observation tutorials

Communities:

  • SkAI-Pinas network
  • Digital Space Campus (CoPhil)
  • DIMER model repository

Session Summary

What We Covered:

✅ AI/ML/DL definitions and relationships
✅ End-to-end ML workflow for EO
✅ Supervised learning (classification, regression)
✅ Unsupervised learning (clustering)
✅ Deep learning & CNNs for satellite imagery
✅ Data-centric AI philosophy
2025 innovations: Foundation models, on-board AI

Q&A

AI/ML Concepts

  • Supervised vs unsupervised?
  • When to use deep learning?
  • Foundation models for my use case?

Practical Questions

  • Data quality challenges?
  • Label collection strategies?
  • Computing requirements?

Next: Session 3

Hands-on Python for Geospatial Data

Coming up after 15-minute break:

  • Google Colab environment setup
  • GeoPandas for vector data
  • Rasterio for raster data
  • Work with Philippine boundaries
  • Load and visualize Sentinel-2 imagery
  • Calculate NDVI

Get ready to code! 💻

Thank You!

Resources

Foundation Models:
NASA-IBM Geospatial: https://huggingface.co/ibm-nasa-geospatial
Prithvi: https://github.com/NASA-IMPACT/Prithvi
Clay: https://clay-foundation.github.io

Learning:
NASA ARSET: https://appliedsciences.nasa.gov/arset
EO College: https://eo-college.org
SkAI-Pinas: https://asti.dost.gov.ph/skai-pinas