Session 3: Object Detection Techniques for Earth Observation
From Faster R-CNN to YOLO/DETR: Counting and Localizing Objects
EU-Philippines CoPhil Programme
Session Overview
Duration: 1.5 hours Type: Theory + Discussion Goal: Master object detection for Earth Observation
You will learn:
- What object detection is and when to use it
- Two‑stage vs single‑stage vs transformer‑based detectors
- Key concepts: anchor boxes, NMS, IoU, mAP
- EO applications: ships, vehicles, buildings, infrastructure
- Architecture selection for Philippine use cases
Prerequisites:
- Day 2 CNNs and Transfer Learning
- Basic understanding of image classification
- Familiarity with Python and deep learning
Resources:
- Hands-on lab in Session 4
- Reference PDF: “Day 3, Session 3_ Object Detection for Earth Observation Imagery.pdf”
Part 1: What is Object Detection?
Definition & Core Concept
Object detection combines two fundamental computer vision tasks:
- Classification: What objects are present in the image?
- Localization: Where exactly are they located?
For each detected object, the model outputs:
- Bounding box coordinates: (x, y, width, height)
- Class label: Object type (ship, vehicle, building)
- Confidence score: Detection probability (0 to 1)
Task Comparison Matrix
| Aspect | Classification | Object Detection | Semantic Segmentation |
|---|---|---|---|
| Question | What’s in this image? | Where are objects? | Which pixels are what? |
| Output | Single label | Bounding boxes + labels | Pixel-wise mask |
| Granularity | Image-level | Object-level | Pixel-level |
| Location Info | None | Approximate (boxes) | Precise (pixels) |
| Count Objects | No | Yes ✓ | Possible |
| Speed | Fastest | Moderate | Slowest |
| Example Use | “Contains buildings” | “10 buildings at coords” | “Building footprints mapped” |
When to Use Each Task?
Choose Object Detection when:
- Need to count individual instances (ships, vehicles, aircraft)
- Bounding box approximation is sufficient
- Real-time or near-real-time processing required
- Objects are well-separated and distinct
EO Examples:
- Ship counting in maritime zones
- Vehicle detection for traffic analysis
- Aircraft monitoring at airports
Choose Semantic Segmentation when:
- Need precise pixel-level boundaries (flood extent, land parcels)
- Accurate area calculations are critical
- Objects have complex shapes not suited to rectangles
- Can afford slower processing time
EO Examples:
- Mapping typhoon flood extent
- Agricultural field delineation
- Building footprint mapping
Philippine Example
Detection vs Segmentation
Counting ships in Manila Bay → Object Detection
Mapping typhoon flood extent → Semantic Segmentation
Part 2: Architecture Families
Evolution of Object Detection
Object detection has evolved through three main architectural paradigms:
- Two-Stage Detectors (2015-2017): Separate proposal + classification
- Single-Stage Detectors (2016-Present): Direct prediction in one pass
- Transformer-Based (2020-Present): Set prediction without anchors
Architecture Comparison
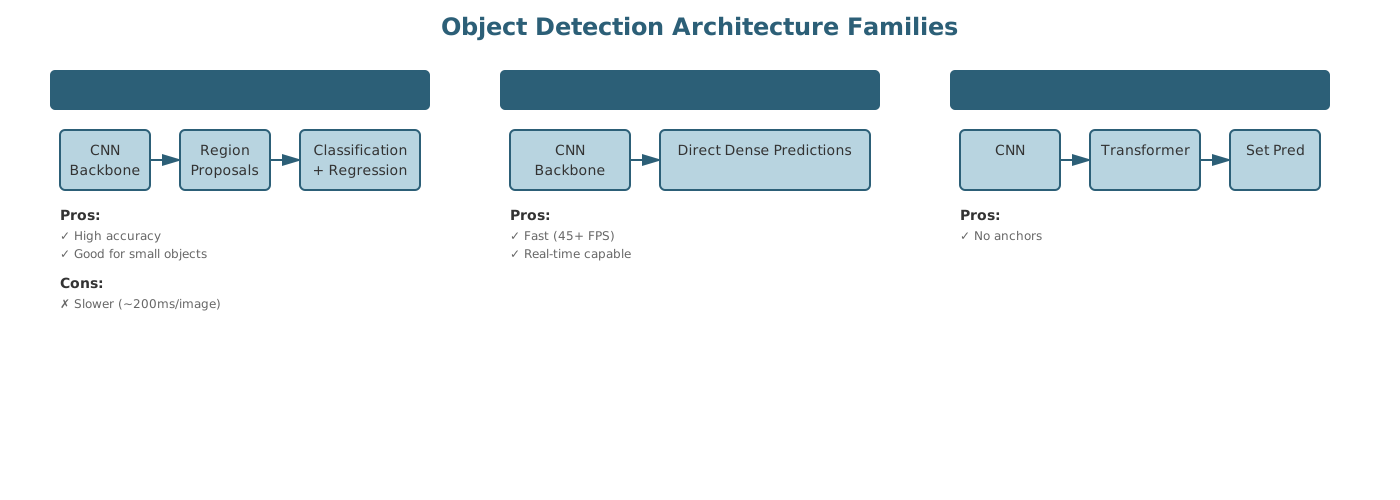
Two-Stage Detectors: Faster R-CNN
Pipeline (4 stages):
- CNN Backbone (e.g., ResNet)
- Extracts feature map from input image
- Region Proposal Network (RPN)
- Generates object proposals
- ROI Pooling
- Extracts features for each proposal
- Classification + Box Regression
- Predicts class and refines coordinates
Faster R-CNN Performance
Performance Metrics
- ~200ms per image on GPU
- High accuracy (mAP ~40% on COCO)
- Excellent for small objects
Pros
- ✓ High accuracy
- ✓ Good for small objects
- ✓ Handles scale variation well
Cons
- ✗ Slower inference
- ✗ More complex architecture
Best for
Precision-critical EO applications:
- Detailed infrastructure surveys
- Small object inventories
- High-precision damage assessment
Key Innovation
RPN replaces slow Selective Search with learned proposal generation
Single-Stage Detectors: YOLO
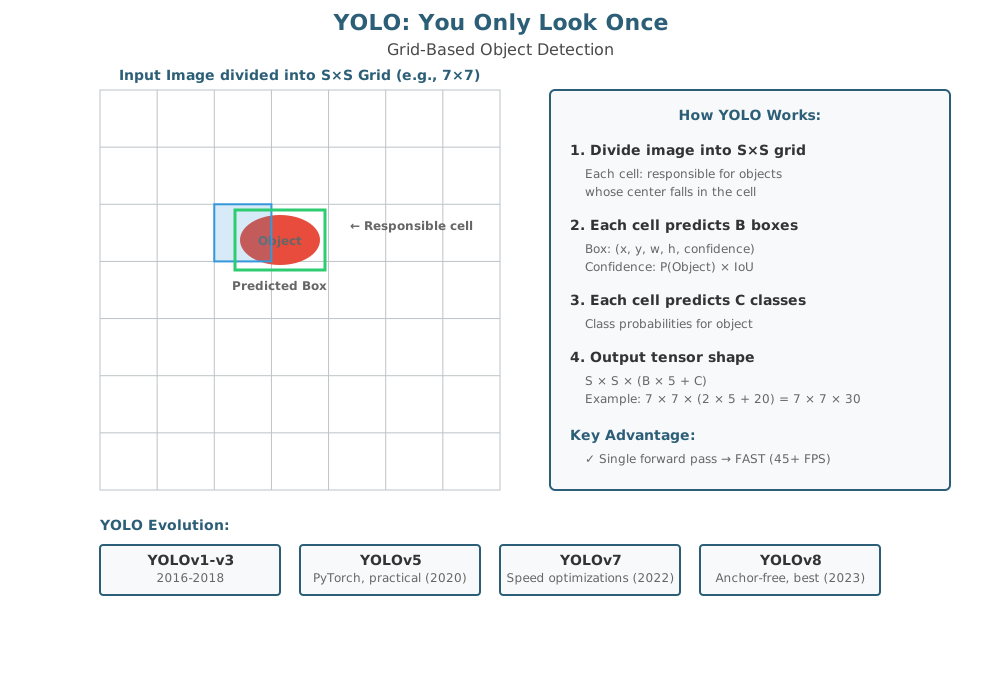
Core Concept: Reframe detection as regression—predict boxes and classes in single forward pass
- Divide image into S×S grid (e.g., 7×7 or 13×13)
- Each grid cell predicts B bounding boxes + confidence
- Each cell predicts C class probabilities
- Output tensor: S × S × (B × 5 + C)
YOLO: Grid-Based Detection
YOLO Evolution Timeline
| Version | Year | Key Features | Notes |
|---|---|---|---|
| YOLOv1-v3 | 2016-2018 | Original development | Grid-based, anchor boxes |
| YOLOv4 | 2020 | Bag of tricks | CSPDarknet, Mish activation |
| YOLOv5 | 2020 | PyTorch implementation | Very practical, widely used |
| YOLOv7 | 2022 | Speed optimizations | E-ELAN, compound scaling |
| YOLOv8 | 2023 | Anchor-free, best perf. | SOTA accuracy + speed |
Performance: 45+ FPS, mAP competitive with two-stage methods
For Philippine EO
YOLOv8 is recommended for most real-time monitoring applications (ships, vehicles, disaster response)
Single-Stage: SSD (Single Shot MultiBox)
Key Innovation
Multi-scale feature maps for detecting objects at different scales
Architecture:
- Base network (VGG or ResNet)
- Multiple convolutional feature layers at different resolutions
- Each layer predicts objects at specific scales
- Combines predictions from all layers
Advantage over YOLO: Better at detecting small objects
Use Cases
- When objects vary significantly in size
- Small object detection (vehicles, small ships)
- Balance between speed and accuracy
Performance
- 59 FPS on VGG16 backbone
- Good accuracy on small objects
- mAP competitive with Faster R-CNN
Best for: Applications requiring both speed and small object detection
Transformer-Based: DETR
Detection Transformer (DETR)
- End-to-end object detection with transformers
- Set prediction via bipartite matching
- No anchors, no NMS needed
- Elegant architecture
How it works:
- CNN backbone extracts features
- Transformer encoder processes features
- Transformer decoder predicts set of objects
- Bipartite matching for training
Pros
- ✓ No hand-crafted components (anchors, NMS)
- ✓ Elegant end-to-end design
- ✓ Good for complex scenes
Cons
- ✗ Requires more training data
- ✗ Longer convergence time
- ✗ Slower than YOLO/SSD
Best for: Research applications, complex multi-object scenes when data is plentiful
Part 3: Key Concepts
Anchor Boxes
Purpose
Provide reference boxes at various scales and aspect ratios that the model adjusts to fit actual objects
How They Work
- Predefined boxes placed at each spatial location
- Model predicts offsets (adjustments) to anchors
- Example: 9 anchors per location (3 scales × 3 aspect ratios)
Example Anchors:
- Scales: 128², 256², 512² pixels
- Aspect ratios: 1:1, 1:2, 2:1
Modern Alternatives
- Anchor-free methods (FCOS, CenterNet, YOLOv8)
- Predict object centers and dimensions directly
- Simpler, fewer hyperparameters
- Better generalization
Trade-offs
- Anchor-based: More established, predictable
- Anchor-free: Simpler, more flexible
Non-Maximum Suppression (NMS)
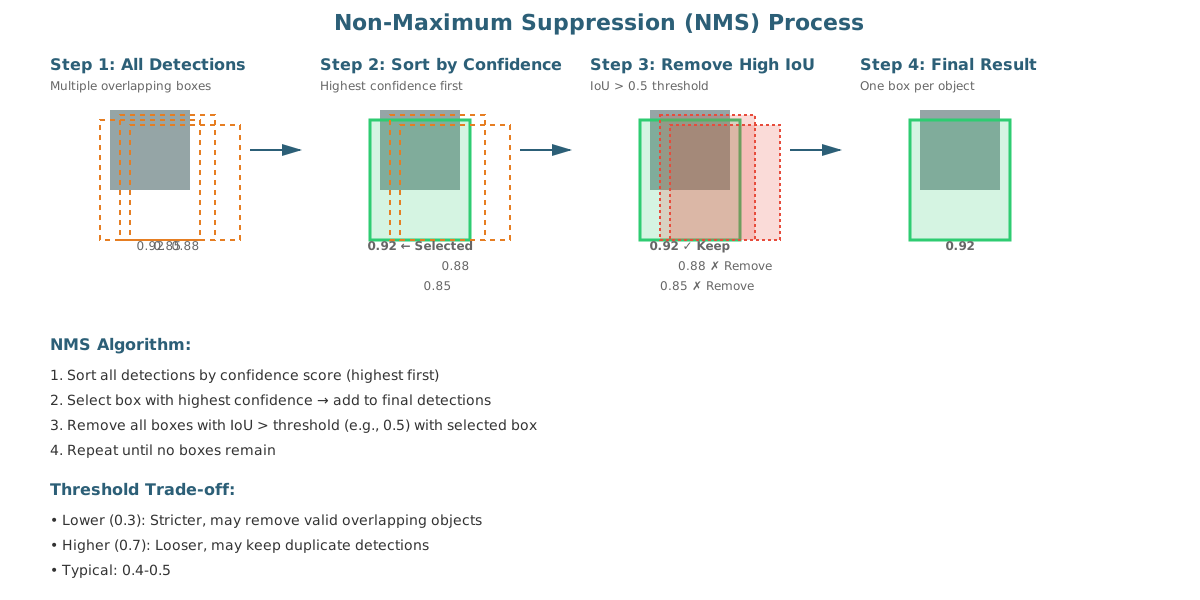
Problem: Detectors generate multiple overlapping boxes for the same object
Solution: Remove duplicate detections through NMS algorithm
NMS Process Visualization
NMS Algorithm Steps
- Sort all detection boxes by confidence score (highest first)
- Select box with highest confidence → add to final detections
- Remove all boxes with IoU > threshold (e.g., 0.5) with selected box
- Repeat until no boxes remain
Threshold Trade-off:
- Lower (0.3): Stricter, may remove valid overlapping objects
- Higher (0.7): Looser, may keep duplicate detections
- Typical: 0.4-0.5
Intersection over Union (IoU)
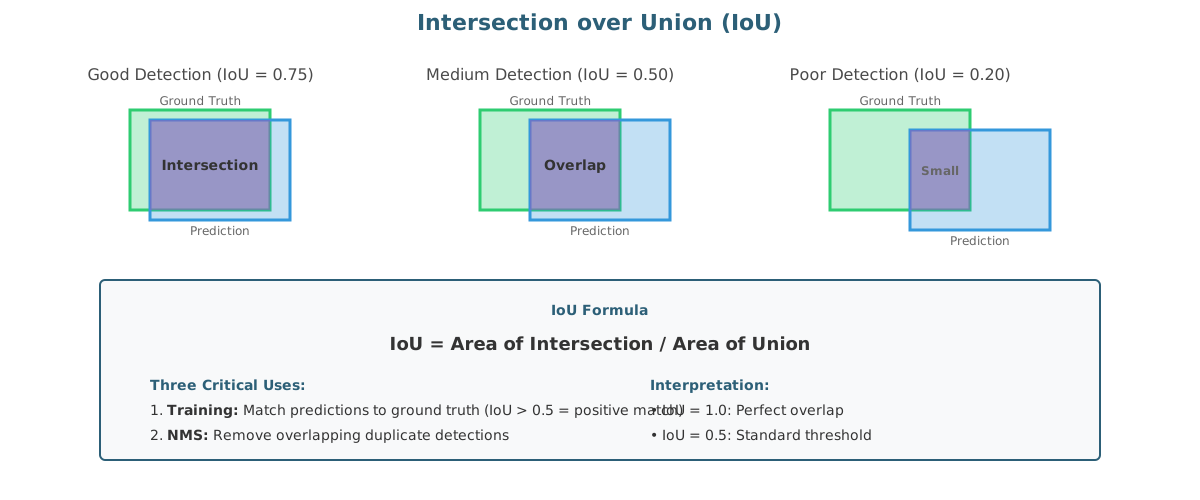
Definition: Measure of overlap between two bounding boxes
\[ \text{IoU} = \frac{\text{Area of Intersection}}{\text{Area of Union}} \]
IoU Visualization
IoU: Three Critical Uses
- Training: Match predictions to ground truth (IoU > 0.5 = positive match)
- NMS: Remove overlapping duplicate detections
- Evaluation: Determine if detection is correct
Interpretation:
- IoU = 1.0: Perfect overlap
- IoU = 0.5: Standard threshold for “correct” detection
- IoU = 0.0: No overlap
Mean Average Precision (mAP)
Primary Evaluation Metric
Calculation Steps:
- For each class:
- Sort detections by confidence
- Compute precision-recall curve
- Calculate Average Precision (AP) = area under curve
- mAP = average AP across all classes
Common Variants:
- mAP@0.5: IoU threshold = 0.5 (PASCAL VOC)
- mAP@0.75: Stricter threshold
- mAP@[0.5:0.95]: Average over range (COCO)
Example Interpretation
- mAP@0.5 = 0.65 → Model achieves 65% average precision at IoU ≥ 0.5
- Higher is better (max = 1.0)
Why Multiple Thresholds?
- mAP@0.5: Lenient, accepts rough localizations
- mAP@0.75: Strict, requires precise boxes
- mAP@[0.5:0.95]: Comprehensive evaluation
For EO Applications:
- Use mAP@0.5 for quick evaluation
- Use mAP@0.75 for precision-critical tasks
Part 4: EO Applications
Application 1: Maritime Surveillance
Philippine Context: Maritime Security
Use Case: Monitor Exclusive Economic Zone (EEZ), detect illegal fishing, track vessel movements
Data Sources:
- Sentinel-1 SAR (all-weather, day-night)
- Sentinel-2 optical (higher resolution)
- High-resolution commercial imagery
Challenges:
- Small objects (10-30 pixels)
- Wave patterns (false positives)
- Scale variation (boats to cargo ships)
- No fixed orientation
Recommended Approach
- Real-time monitoring: YOLOv8 for speed
- Precision inventory: Faster R-CNN for accuracy
- Multi-scale training essential
Expected Performance
- YOLOv8: mAP ~0.70, 30+ FPS
- Faster R-CNN: mAP ~0.80, 5-10 FPS
Key Considerations
- SAR requires different preprocessing
- Wave patterns need careful handling
- Multi-temporal analysis helps distinguish static objects
Ship Detection Benefits
- Automated monitoring of vast maritime zones
- Illegal fishing detection in protected areas
- Traffic analysis in shipping lanes
- Search and rescue operations support
- Maritime security enforcement
Session 4 Preview
Tomorrow’s hands-on lab: Implement object detection for Philippine use cases!
Application 2: Urban Monitoring
Vehicle Detection
Use Case: Traffic flow, parking, planning
- Data: VHR satellites (<1m resolution)
- Challenges: Very small (5-10 pixels), dense
- Approach: Faster R-CNN + FPN
Expected Performance:
- mAP ~0.60-0.70 for vehicles
- Better in sparse areas
Building Detection
Use Case: Asset inventory, informal settlement mapping, damage assessment
- Data: Sentinel-2 (10m) or VHR
- Challenges: Size variation, shadows
- Approach: YOLOv5/v8 or Faster R-CNN
Philippine Application:
- Informal settlement monitoring (Metro Manila)
- Disaster damage assessment (post-typhoon)
- Urban growth tracking
Application 3: Infrastructure Monitoring
Oil Tank Detection
- Distinctive circular shape aids detection
- High reflectance in optical imagery
- Strategic infrastructure monitoring
- Regular size distribution
Approach: Faster R-CNN or circular Hough + CNN
Performance: mAP ~0.85+ (easier due to distinct shape)
Aircraft Detection
- Airport activity monitoring
- Medium-sized objects (20-50 pixels)
- High contrast against runways
- Fewer orientation variations
Approach: YOLO series for real-time
Performance: mAP ~0.75-0.85
Use Cases: Airport traffic analysis, capacity planning
Part 5: EO-Specific Challenges
Challenge 1: Small Object Detection
The Problem
Many EO objects are tiny relative to image size:
- Ships: 10-30 pixels in Sentinel-1/2
- Vehicles: 5-10 pixels in satellite imagery
Why Difficult
- Feature maps downsample spatial resolution
- Small objects lose critical information
- Insufficient features for classification
- Standard anchors may not cover small scales
Solutions
- Multi-scale feature pyramids (FPN architecture)
- Higher-resolution input images
- Tile large images into smaller patches
- Multi-scale training with different input sizes
- Specialized architectures for small objects
- Data augmentation focusing on scale
Best Practices
- Use FPN or PANet architectures
- Train with tiles (512×512 or 1024×1024)
- Include small-scale anchors
Challenge 2: Scale & Orientation Variation
Scale Variation
Same object type at vastly different scales:
- Small fishing boat vs. cargo ship (10× difference)
- Compact car vs. truck
- Single-story vs. high-rise building
Orientation
Objects at any angle in overhead imagery:
- Ships at various headings
- No canonical viewpoint
- 360° rotation possible
Solutions
- Multi-scale anchor boxes covering expected ranges
- Rotation-invariant features or augmentation
- Oriented bounding boxes (OBB) instead of axis-aligned
- Multi-scale training protocol
- Rotation augmentation during training
Implementation
- YOLOv8 with rotation augmentation
- Rotated Region CNN (R2CNN) for OBB
- Data augmentation: 0°, 90°, 180°, 270°
Challenge 3: Complex Backgrounds
The Problem
Satellite imagery contains many distractors:
- Urban clutter (shadows, roads, rooftops)
- Wave patterns mimicking ships
- Terrain texture variations
- Seasonal appearance changes
Impact
- False positives increase
- Model confidence decreases
- Precision suffers
Solutions
- Contextual information (use surrounding region)
- Stronger backbone networks (ResNet-101, EfficientNet)
- Hard negative mining during training
- Domain-specific preprocessing
- Attention mechanisms to focus on features
Best Practices
- Include diverse backgrounds in training
- Use hard negative mining
- Apply domain-specific filters
- Consider contextual features
Challenge 4: Limited Labeled Data
The Problem
Annotating EO imagery is expensive and time-consuming:
- Requires domain expertise
- Large images mean many objects
- Ground truth often unavailable
- Manual annotation costly
Impact
- Model overfitting
- Poor generalization
- Limited object type coverage
Solutions
- Transfer learning from COCO or ImageNet
- Self-supervised pre-training on unlabeled EO data
- Semi-supervised learning approaches
- Active learning for informative samples
- Synthetic data generation
- Data augmentation to increase dataset size
Philippine Context
- Use pre-trained models from similar domains
- Collaborate with government agencies
- Leverage existing datasets (xView, DOTA)
Challenge 5: Atmospheric & Quality Issues
Unique EO Challenges
- Cloud cover and shadows
- Haze and aerosol scattering
- Seasonal illumination variations
- Sensor noise and artifacts
- Variable imaging conditions
Impact
- Reduced image quality
- Inconsistent appearance
- Lower detection confidence
- Temporal variations
Solutions
- Robust preprocessing (atmospheric correction, normalization)
- SAR data as weather-independent alternative
- Multi-temporal fusion to handle clouds
- Domain adaptation techniques
- Augmentation simulating atmospheric effects
Best Practices
- Use Sentinel-1 SAR for all-weather capability
- Apply atmospheric correction
- Normalize across scenes
- Train on diverse conditions
Part 6: Architecture Selection
Decision Framework: Two-Stage Detectors
Use Faster R-CNN When:
- ✓ Accuracy is paramount over speed
- ✓ Detecting small objects (ships, vehicles)
- ✓ Objects have high scale variation
- ✓ Can afford longer inference time
- ✓ Have good quality labeled training data
Example EO Applications:
- Detailed infrastructure surveys
- Small object inventories (ship counting)
- High-precision damage assessment
- Building footprint extraction
Decision Framework: Single-Stage Detectors
Use YOLO or SSD When:
- ✓ Speed is critical (real-time monitoring)
- ✓ Objects are medium-to-large size
- ✓ Can accept slightly lower accuracy
- ✓ Need to process many images quickly
- ✓ Resource-constrained deployment
Example EO Applications:
- Real-time maritime surveillance
- Rapid disaster response (initial assessment)
- Large-area scanning for anomalies
- Drone video analysis
Philippine EO Application Guide
| Application | Recommended Architecture | Key Reasoning |
|---|---|---|
| Ship Detection (EEZ) | YOLOv8 or Faster R-CNN | Balance speed vs accuracy |
| Vehicle Counting | Faster R-CNN + FPN | Very small objects |
| Building Detection | YOLOv5/v8 | Good balance |
| Aircraft Monitoring | YOLO series | Real-time, medium objects |
| Oil Tank Inventory | Faster R-CNN | Precision matters |
| Disaster Assessment | YOLOv8 | Rapid large-area scans |
| Informal Settlement | YOLOv8 or Faster R-CNN | Speed vs detail trade-off |
Decision Framework: Transformer-Based
Use DETR When:
- ✓ Have large training dataset
- ✓ Want elegant architecture without heuristics
- ✓ Can afford longer training time
- ✓ Working on research/cutting-edge applications
- ✓ Complex scene understanding matters
Considerations:
- Requires more data than CNN-based methods
- Longer training convergence
- May not be faster than optimized YOLO
- Good for eliminating manual tuning
Current Status:
- Still evolving, less mature than YOLO/Faster R-CNN
- Better suited for research than production
- Consider Deformable DETR for better performance
Part 7: Resources & Summary
Foundational Papers
Two-Stage Detectors
- Girshick et al. (2014) - R-CNN: Rich feature hierarchies
- Ren et al. (2015) - Faster R-CNN with RPN
Single-Stage Detectors
- Redmon et al. (2016) - YOLO: Unified detection
- Liu et al. (2016) - SSD: Single Shot MultiBox
- Lin et al. (2017) - RetinaNet with Focal Loss
Transformer-Based
- Carion et al. (2020) - DETR: End-to-End Detection
EO-Specific
- Ship detection surveys
- Building detection in remote sensing
- Small object detection in aerial imagery
Frameworks and Datasets
Popular Implementations
- Ultralytics YOLOv8 - Most user-friendly
- Detectron2 - Facebook AI framework
- MMDetection - Comprehensive toolbox
Pre-trained Models
- TensorFlow Model Zoo
- PyTorch Hub
- Model Zoo
EO-Specific Datasets
- DOTA: Large-scale aerial images
- DIOR: Optical remote sensing
- xView: Largest overhead imagery dataset
Philippine EO Resources
- PhilSA: Maritime surveillance
- NAMRIA: Infrastructure mapping
- DOST-ASTI: DATOS disaster response
Key Takeaways
Object Detection Fundamentals
- Combines classification + localization with bounding boxes
- Outputs: box coordinates, class, confidence
- Distinct from classification and segmentation
- Primary use: counting and locating instances
Architecture Categories
- Two-stage: Accurate, slower, good for small objects
- Single-stage: Fast, real-time, competitive accuracy
- Transformer: Elegant, data-hungry, research-focused
Key Concepts
- Anchor boxes provide reference scales
- NMS removes duplicate detections
- IoU measures box overlap
- mAP is the standard evaluation metric
EO-Specific Challenges
- Small objects, scale variation, complex backgrounds
- Atmospheric effects, limited labeled data
- Solutions: multi-scale features, transfer learning, augmentation
Next: Session 4 Hands-on Lab
What You’ll Do:
- Load Sentinel-2 imagery of Metro Manila
- Use pre-trained object detection model (YOLO)
- Fine-tune on building detection dataset
- Evaluate performance using mAP metric
- Visualize detected bounding boxes
- Export results for GIS integration
Case Study: Building Detection in Metro Manila
- Location: Metro Manila (Quezon City or Pasig River)
- Relevance: Urban monitoring, disaster vulnerability
- Data: Pre-prepared Sentinel-2 patches with annotations
- Approach: Transfer learning with pre-trained detector
Expected Results: mAP > 0.60 with fine-tuned model
Discussion Questions
Before moving to the hands-on session, consider:
For your EO applications, would you prioritize speed (YOLO) or accuracy (Faster R-CNN)? Why?
How would you handle limited labeled training data for Philippine-specific object types?
What validation strategy would ensure your model generalizes across different Philippine regions?
How might you combine object detection with other techniques for disaster damage assessment?
Thank You!
Questions?
Next: Session 4 - Hands-on Object Detection Lab
Contact: CoPhil Training Programme

DAY 3 - Session 3 | Object Detection for EO | 20-23 October 2025